
Western Blot Quantification: A Complete Guide to Accurate Protein Expression Analysis
Convert protein band intensity into reliable, publication-ready quantitative data, fast, standardized, and reproducible.
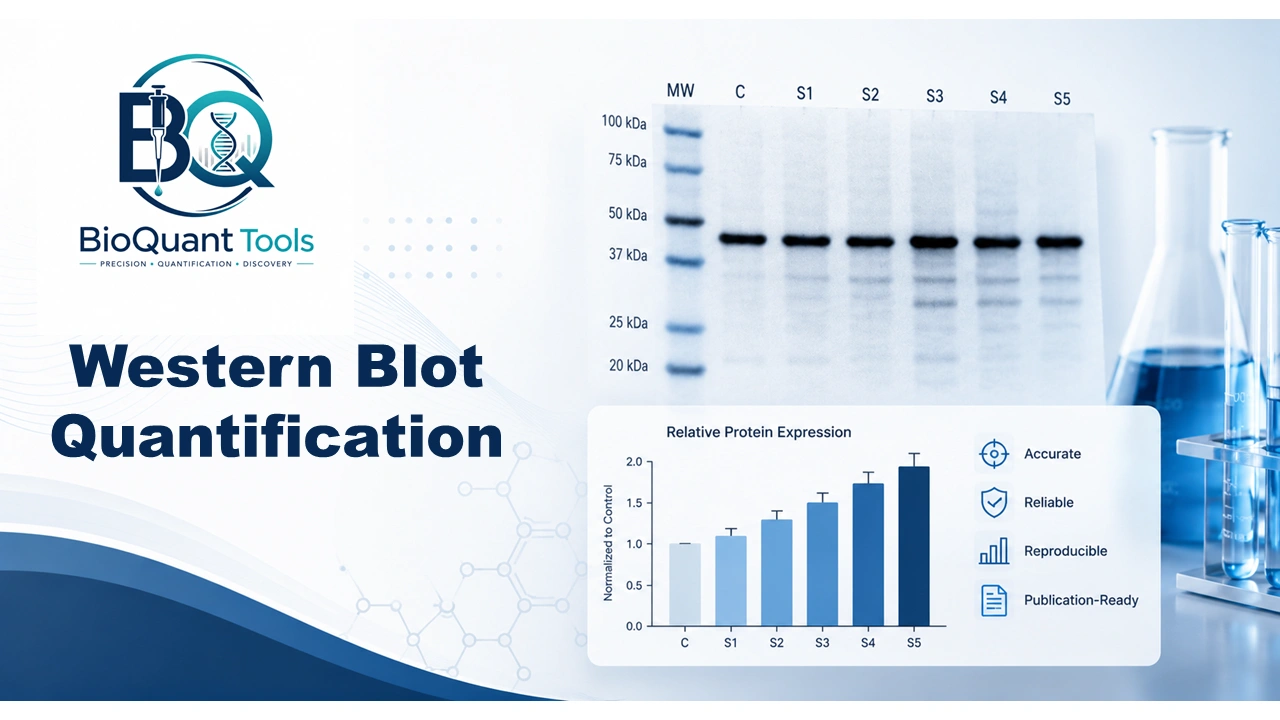
Introduction
Western blotting remains one of the most widely used laboratory techniques for studying protein expression, validating biomarkers, and investigating signaling pathways in molecular biology, cancer research, immunology, neuroscience, and drug discovery. Although generating a western blot image is a crucial experimental step, obtaining scientifically reliable quantitative data from that image is often even more challenging.
Researchers frequently spend days or even weeks optimizing antibodies, protein extraction protocols, gel electrophoresis conditions, membrane transfer, and chemiluminescent detection. However, many studies still lose accuracy during the final step, the quantitative analysis of protein bands.
Western blot quantification, also known as densitometric analysis, converts the visual intensity of protein bands into numerical values that can be statistically analyzed. This process enables researchers to compare protein expression levels between experimental groups, determine fold changes, evaluate treatment responses, and generate publication-quality figures.
To simplify this process, the BioQuant Western Blot Quantification Tool was developed as an intuitive online platform that assists researchers in analyzing western blot data quickly, consistently, and reproducibly, without complex software installations or manual spreadsheet calculations.
What Is Western Blot Quantification?
Western blot quantification is the process of measuring protein abundance by calculating the intensity of detected protein bands. Following antibody detection, each band contains pixel intensity information corresponding to the amount of target protein present in the sample. Densitometry software converts these image signals into numerical intensity values that can subsequently be normalized and statistically compared.
The Typical Workflow
- Acquiring a high-quality western blot image
- Measuring band intensity
- Correcting background signal
- Normalizing against an appropriate loading control
- Calculating relative protein expression
- Computing fold changes between experimental groups
- Performing statistical analysis
The resulting quantitative values are then used to create graphs suitable for scientific publications, grant applications, dissertations, and laboratory reports.
Why Quantitative Analysis Is More Important Than Ever
Modern biomedical research increasingly depends on reproducible quantitative data. Whether investigating cancer biomarkers, inflammatory signaling, neurodegeneration, stem cell differentiation, or therapeutic targets, researchers must demonstrate statistically significant differences in protein expression rather than relying on visual interpretation alone.
Funding agencies, scientific journals, and peer reviewers now expect authors to report quantitative protein expression values, normalization strategy, replicate measurements, statistical significance, fold-change calculations, and raw image availability. Simply presenting darker or lighter protein bands is no longer sufficient for publication in most high-impact journals.
Applications of Western Blot Quantification
Accurate quantitative western blot analysis plays an essential role across numerous research disciplines:
Cancer Biology
Biomarker and pathway validation in tumor studies.
Immunology & Signaling
Cell signaling and immune response investigations.
Neuroscience
Neurodegeneration and stem cell differentiation studies.
Drug Discovery
Phosphorylation studies, gene knockdown, and CRISPR validation.
In all of these applications, quantitative analysis transforms qualitative protein bands into measurable biological evidence that supports experimental conclusions.
Common Sources of Error in Western Blot Quantification
Obtaining a clear western blot image is only the beginning of the analysis. Even small analytical mistakes can lead to incorrect conclusions about protein expression and compromise the reproducibility of an entire study.
1. Image Quality: The Foundation of Reliable Quantification
Common image-related problems include overexposed membranes, underexposed bands, uneven illumination, high background noise, air bubbles during transfer, membrane contamination, dust particles, smiling bands from uneven electrophoresis, and distorted lanes. These artifacts interfere with densitometric measurements because software analyzes pixel intensity rather than biological information.
2. Band Saturation
When exposure time is too long, the detector reaches its maximum signal intensity, additional protein no longer increases recorded intensity, causing signal compression. As a result, two samples with different protein concentrations may appear identical, fold-change calculations become inaccurate, and statistical analysis loses biological meaning. Always optimize antibody concentration and exposure time before quantitative analysis.
3. Uneven Background Signal
Background originates from non-specific antibody binding, membrane autofluorescence, chemiluminescent noise, camera sensor variation, and incomplete blocking. Modern workflows recommend subtracting local background surrounding each individual band rather than applying one global value to the entire membrane.
4. Incorrect Region of Interest (ROI) Selection
Inconsistent ROI selection is a major source of user-to-user variability, different ROI sizes between lanes, including neighboring bands, excluding faint edges, or shifting ROI position. Use identical ROI dimensions for all lanes, ensure the ROI fully encompasses the band without overlapping adjacent signals, and apply consistent measurement criteria across the entire blot.
5. Loading Variability
Equal protein loading is fundamental for meaningful comparison, yet slight differences commonly occur during extraction, sample preparation, pipetting, gel loading, and membrane transfer. Without normalization, these technical variations may be incorrectly interpreted as biological differences.
| Sample | Raw Band Intensity |
|---|---|
| Control | 10,500 |
| Treatment | 12,300 |
At first glance, the treatment appears to increase protein expression. However, if more total protein was loaded into the treatment lane, this apparent increase may simply reflect loading variability rather than a true biological effect. Normalization corrects for these differences.
Why Normalization Matters
Normalization converts raw intensity values into biologically meaningful data by accounting for technical variation. Without it, pipetting errors, transfer efficiency variation, and loading differences remain uncorrected, making statistical comparisons unreliable.
Housekeeping Protein Normalization
Common loading controls include β-Actin (ACTB), GAPDH, α-Tubulin, β-Tubulin, and Vinculin.
Although widely used, recent studies show that housekeeping proteins are not always expressed at constant levels, expression can vary by cell type, tissue type, drug treatment, disease state, and experimental conditions. Relying solely on housekeeping proteins may introduce systematic bias.
Total Protein Normalization (TPN): An Emerging Standard
Instead of measuring a single reference protein, TPN quantifies the total amount of protein transferred to each lane. Advantages include reduced dependence on a single control protein, improved reproducibility across experiments, better performance when housekeeping proteins are regulated by experimental conditions, and enhanced compliance with current journal recommendations.
Biological Replicates vs Technical Replicates
Technical replicates assess the consistency of the measurement process (e.g., repeated loading or repeated image analysis of the same sample). Biological replicates represent independent biological samples and capture natural biological variability. Reliable conclusions require an adequate number of biological replicates rather than relying solely on repeated measurements of the same sample.
Manual Quantification vs Automated Analysis
Manual densitometry can be time-consuming and prone to operator bias, inconsistent ROI placement, calculation errors, manual data transfer into spreadsheets, variable background subtraction, and reduced reproducibility between users. Automated or semi-automated analysis tools help standardize these steps, reduce human error, and improve consistency.
The BioQuant Western Blot Quantification Tool is designed to simplify this workflow by guiding researchers through quantitative analysis with a user-friendly interface, minimizing manual calculations while promoting standardized and reproducible data processing.
How the BioQuant Tool Simplifies Protein Analysis
Modern biomedical research demands not only accurate experimental techniques but also efficient and reproducible data analysis. Rather than replacing good laboratory practice, the tool complements experimental workflows by reducing manual calculations, minimizing transcription errors, and improving data organization.
A Typical Western Blot Quantification Workflow
| Step | Description |
|---|---|
| 1. Generate a high-quality western blot | Equal loading, high-quality transfer, specific antibodies, minimal background, non-saturated detection. |
| 2. Measure band intensities | Intensity is measured within the linear dynamic range of the imaging system. |
| 3. Normalize protein expression | Normalize against β-Actin, GAPDH, α-Tubulin, total protein signal, or another validated control. |
| 4. Calculate relative expression | Express protein levels relative to a control group. |
| 5. Perform statistical analysis | Calculate mean, SD, SEM, fold change, % change, p-values, and confidence intervals. |
| Group | Relative Expression |
|---|---|
| Control | 1.00 |
| Drug A | 1.45 |
| Drug B | 0.72 |
This presentation allows rapid interpretation of upregulation or downregulation relative to baseline.
Why Researchers Need an Integrated Quantification Tool
Traditional workflows often require multiple disconnected software packages: analyzing the image in one program, exporting intensity values, copying data into Excel, calculating normalization manually, computing fold changes, generating graphs separately, and reformatting tables for publication. Each additional step increases the possibility of human error.
The BioQuant Western Blot Quantification Tool streamlines this workflow by providing a centralized environment for organizing quantitative data and reducing repetitive manual calculations.
Key Advantages of the BioQuant Tool
User-Friendly Interface
Designed for both experienced investigators and students with limited image-analysis experience.
Faster Data Processing
Rapidly organize and analyze quantitative measurements instead of repetitive spreadsheet work.
Improved Data Consistency
Standardized calculation procedures reduce variability, valuable in collaborative labs.
Reduced Human Error
Automated workflows minimize copy-paste mistakes, formula errors, and incorrect normalization.
Better Reproducibility
Standardized analytical workflows improve consistency between experiments and biological replicates.
Publication-Ready Output
Organized tables and graphs that are easy to adapt for figures and reports.
Example Workflow
Consider a researcher investigating the effect of a novel anticancer compound on the expression of the apoptosis-related protein BAX. After completing the western blot experiment, the following normalized values are obtained:
| Sample | Relative BAX Expression |
|---|---|
| Control | 1.00 |
| Low Dose | 1.28 |
| Medium Dose | 1.74 |
| High Dose | 2.36 |
These results indicate a dose-dependent increase in BAX protein expression, suggesting activation of apoptotic pathways. By presenting normalized quantitative values rather than relying solely on visual inspection of the blot, the researcher provides stronger evidence to support the biological conclusion.
Publication-Quality Data Presentation
A publication-quality figure typically includes representative blot images, molecular weight markers, normalized intensity graphs, error bars, statistical significance indicators, the number of biological replicates, and a description of the normalization strategy. Combining visual evidence with quantitative analysis enhances the credibility and reproducibility of experimental findings.
Common Mistakes to Avoid
Quantifying saturated bands
Using inconsistent ROI sizes
Ignoring background correction
Choosing unstable housekeeping proteins
Comparing blots with different exposure settings
Relying on technical instead of biological replicates
Omitting normalization details in publications
Reporting images without quantitative analysis
Best Practices for Accurate Western Blot Quantification
- Use high-quality, non-saturated images
- Keep exposure settings consistent across all samples
- Apply uniform ROI dimensions
- Perform appropriate local background subtraction
- Normalize using a validated loading control or total protein signal
- Include sufficient biological replicates
- Report all normalization methods transparently
- Present raw images alongside quantified data whenever possible
- Archive original image files for future verification
Frequently Asked Questions
What is western blot quantification?
The process of measuring protein band intensity and converting image signals into numerical values for statistical comparison of protein expression.
Why is normalization necessary?
Normalization corrects for differences in protein loading and transfer efficiency, ensuring observed changes reflect true biological variation rather than technical artifacts.
Which loading control should I use?
It depends on the experimental system. β-Actin, GAPDH, and α-Tubulin remain widely used, but many recent studies recommend total protein normalization for greater stability across biological conditions.
Can I compare bands from different membranes?
Only if experimental conditions, imaging parameters, normalization strategy, and appropriate inter-blot controls are carefully maintained. Direct comparison without proper controls is generally discouraged.
Does a darker band always indicate higher protein expression?
Not necessarily. Signal saturation, uneven background, or differences in exposure time can make bands appear darker without representing proportional increases in protein abundance, quantitative densitometric analysis is essential.
Conclusion
Western blotting remains one of the most trusted techniques for protein expression analysis, but the reliability of experimental conclusions depends on rigorous quantitative analysis. Careful attention to image quality, background correction, normalization, and statistical evaluation is essential for generating reproducible, publication-quality data.
The BioQuant Western Blot Quantification Tool is designed to simplify this process by helping researchers organize quantitative measurements, reduce manual calculation errors, and streamline data analysis, supporting students, researchers, and laboratory professionals in producing accurate, reproducible, and publication-ready results.
Explore More BioQuant Tools
Related Scientific Resources
Quantify Your Western Blot Today
Fast, accurate, and free, no software installation required.
Go to the Tool →